Generating Infographics from Podcasts
I tested whether structuring content before generating an infographic matters. It does.
I wanted to turn YouTube videos into infographics programmatically. NotebookLM does this when you click “Generate Infographic,” and I wanted to know if I could replicate it with an API.
I looked at TLDW.us, but they do text summaries with timestamps, not visual infographics. So I decided to test the approach myself.
The test content was a 40-minute Andrew Mwenda interview on The Long Form about Uganda-Rwanda relations, Kagame’s leadership, and the risk of unintended war. Dense material with multiple speakers and personal anecdotes mixed with geopolitical analysis.
I wanted to know if structuring content before generating matters, or if you can just dump the transcript in and let the AI figure it out. So I tried both approaches.
The two approaches
Approach 1: Dump the raw transcript into NotebookLM or Gemini and generate an infographic directly.
Approach 2: First extract sections, identify key quotes, and understand the structure. Then write a detailed prompt specifying exactly what should appear in each section. Then generate.
Raw dump results
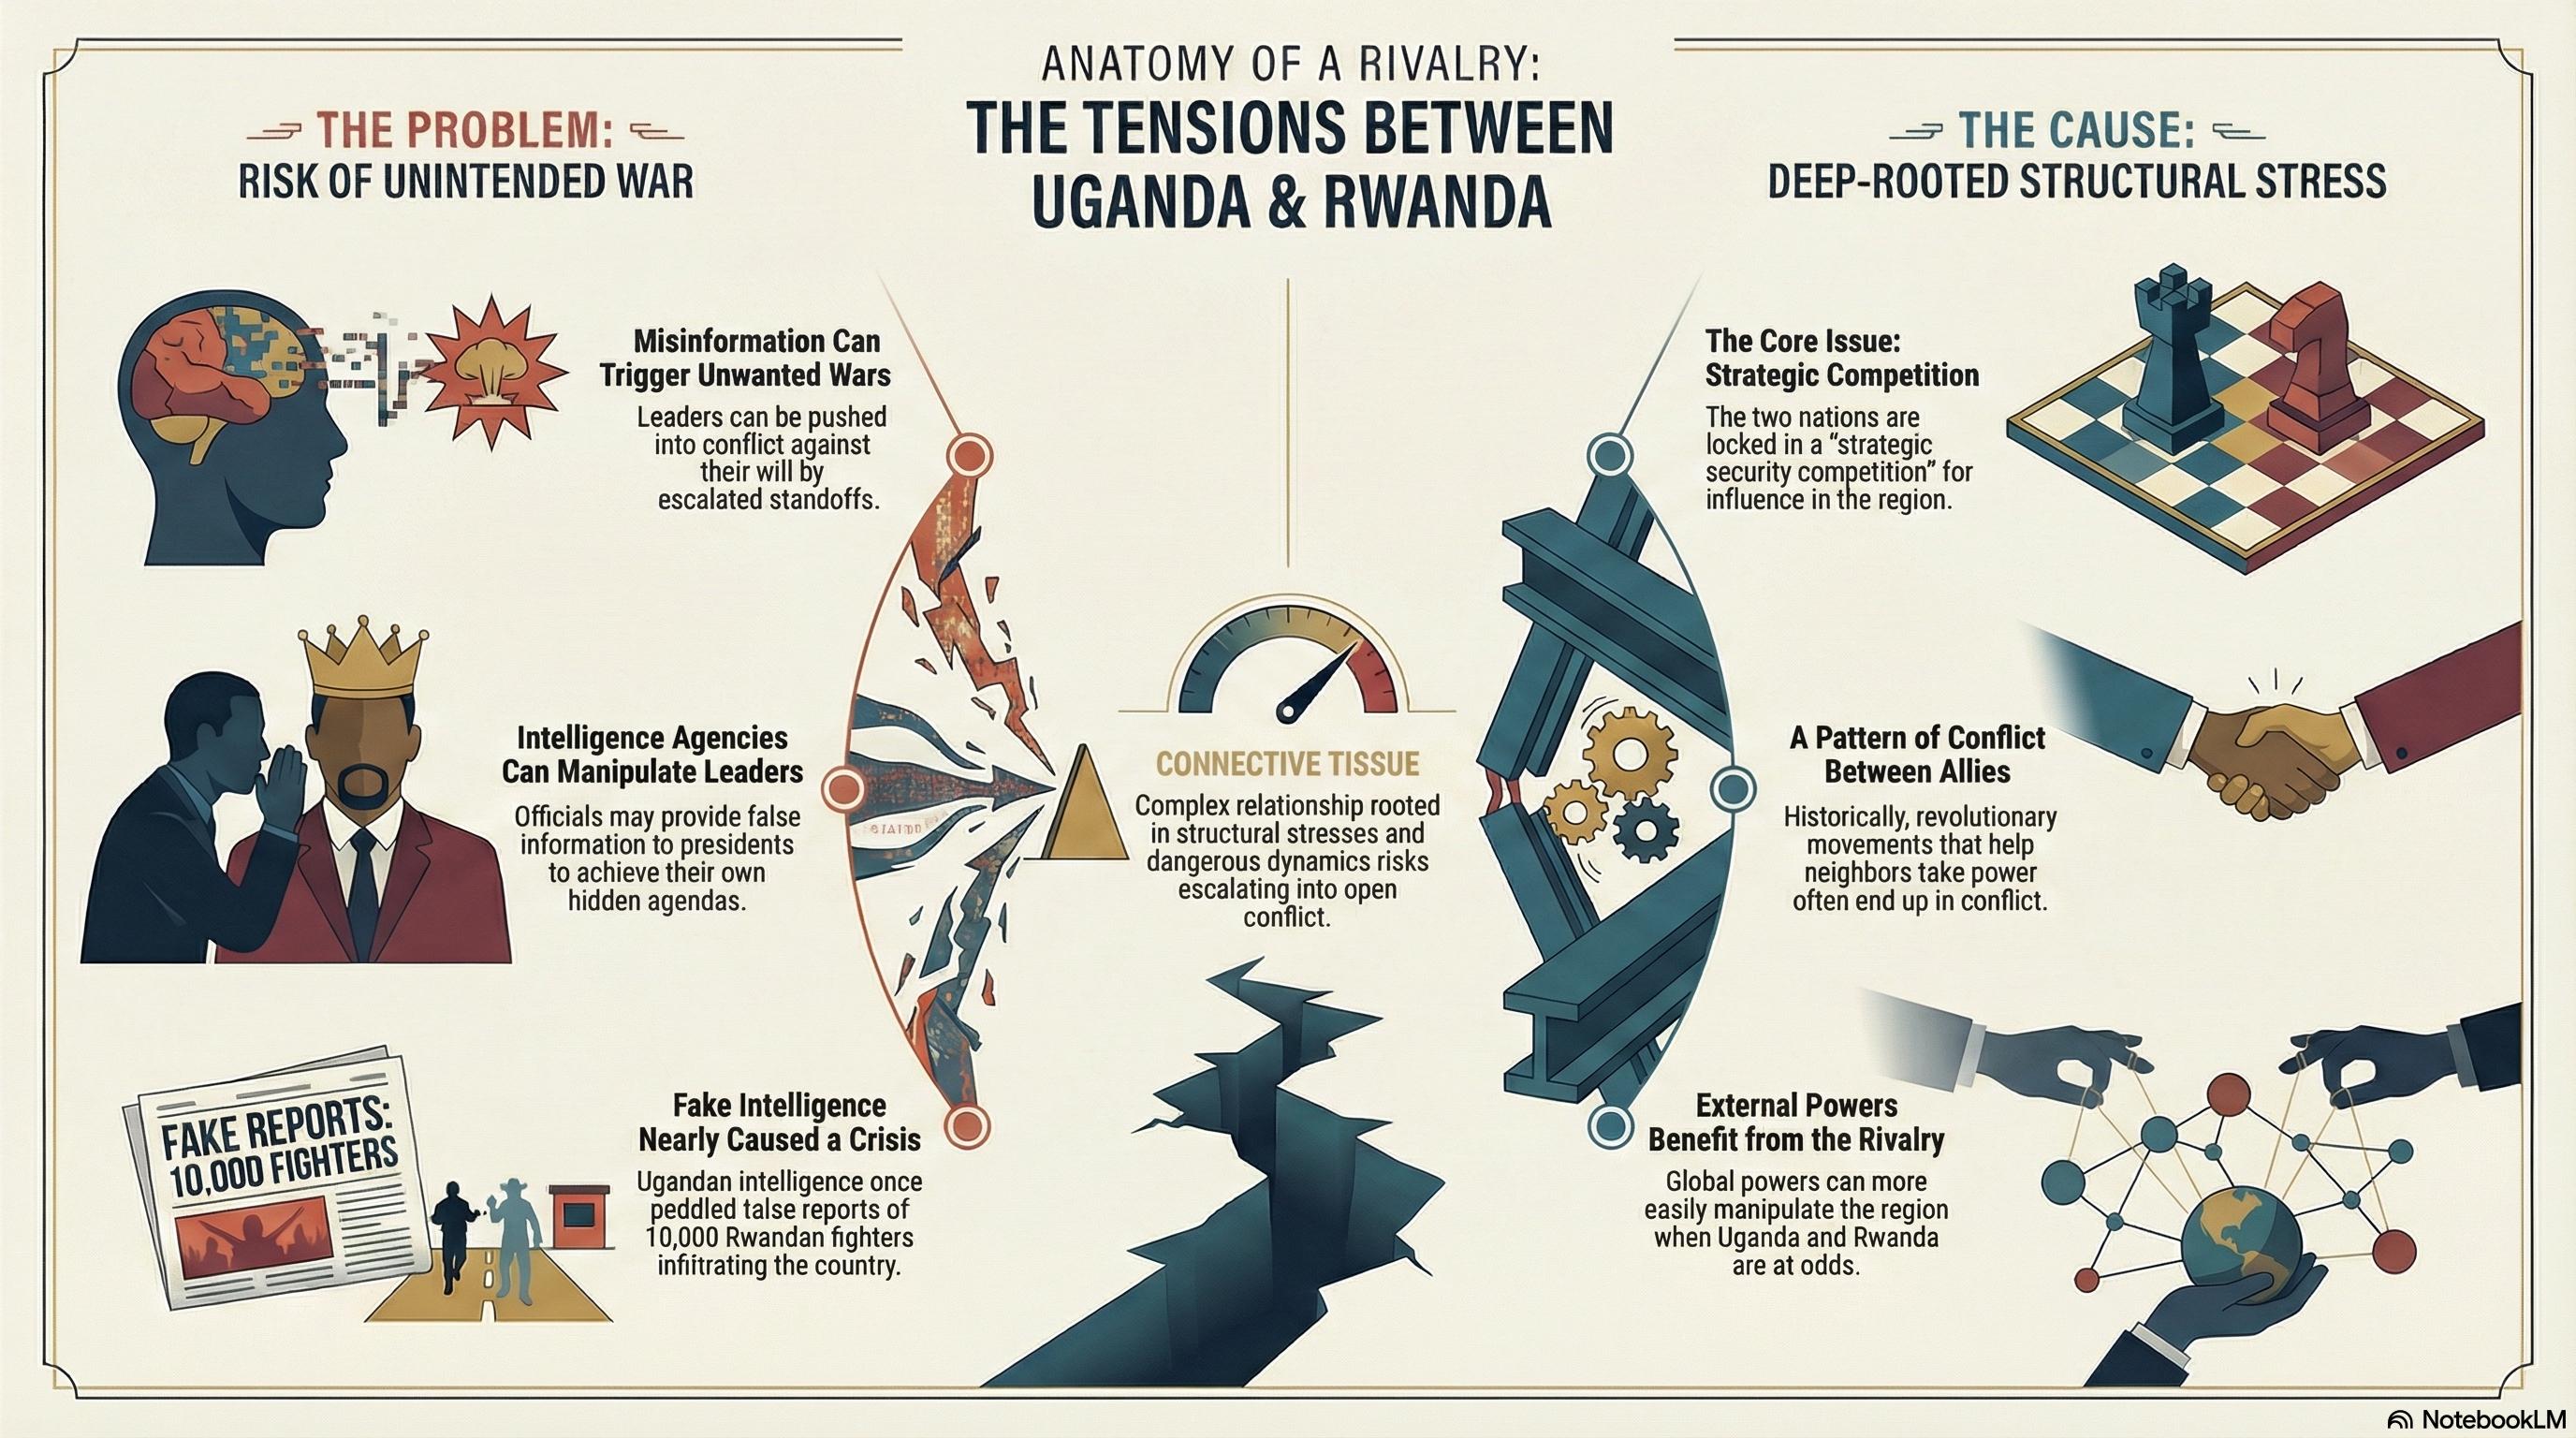
NotebookLM’s general mode focused entirely on the Uganda-Rwanda conflict and ignored about 60% of the conversation. It looked clean but missed most of the content.
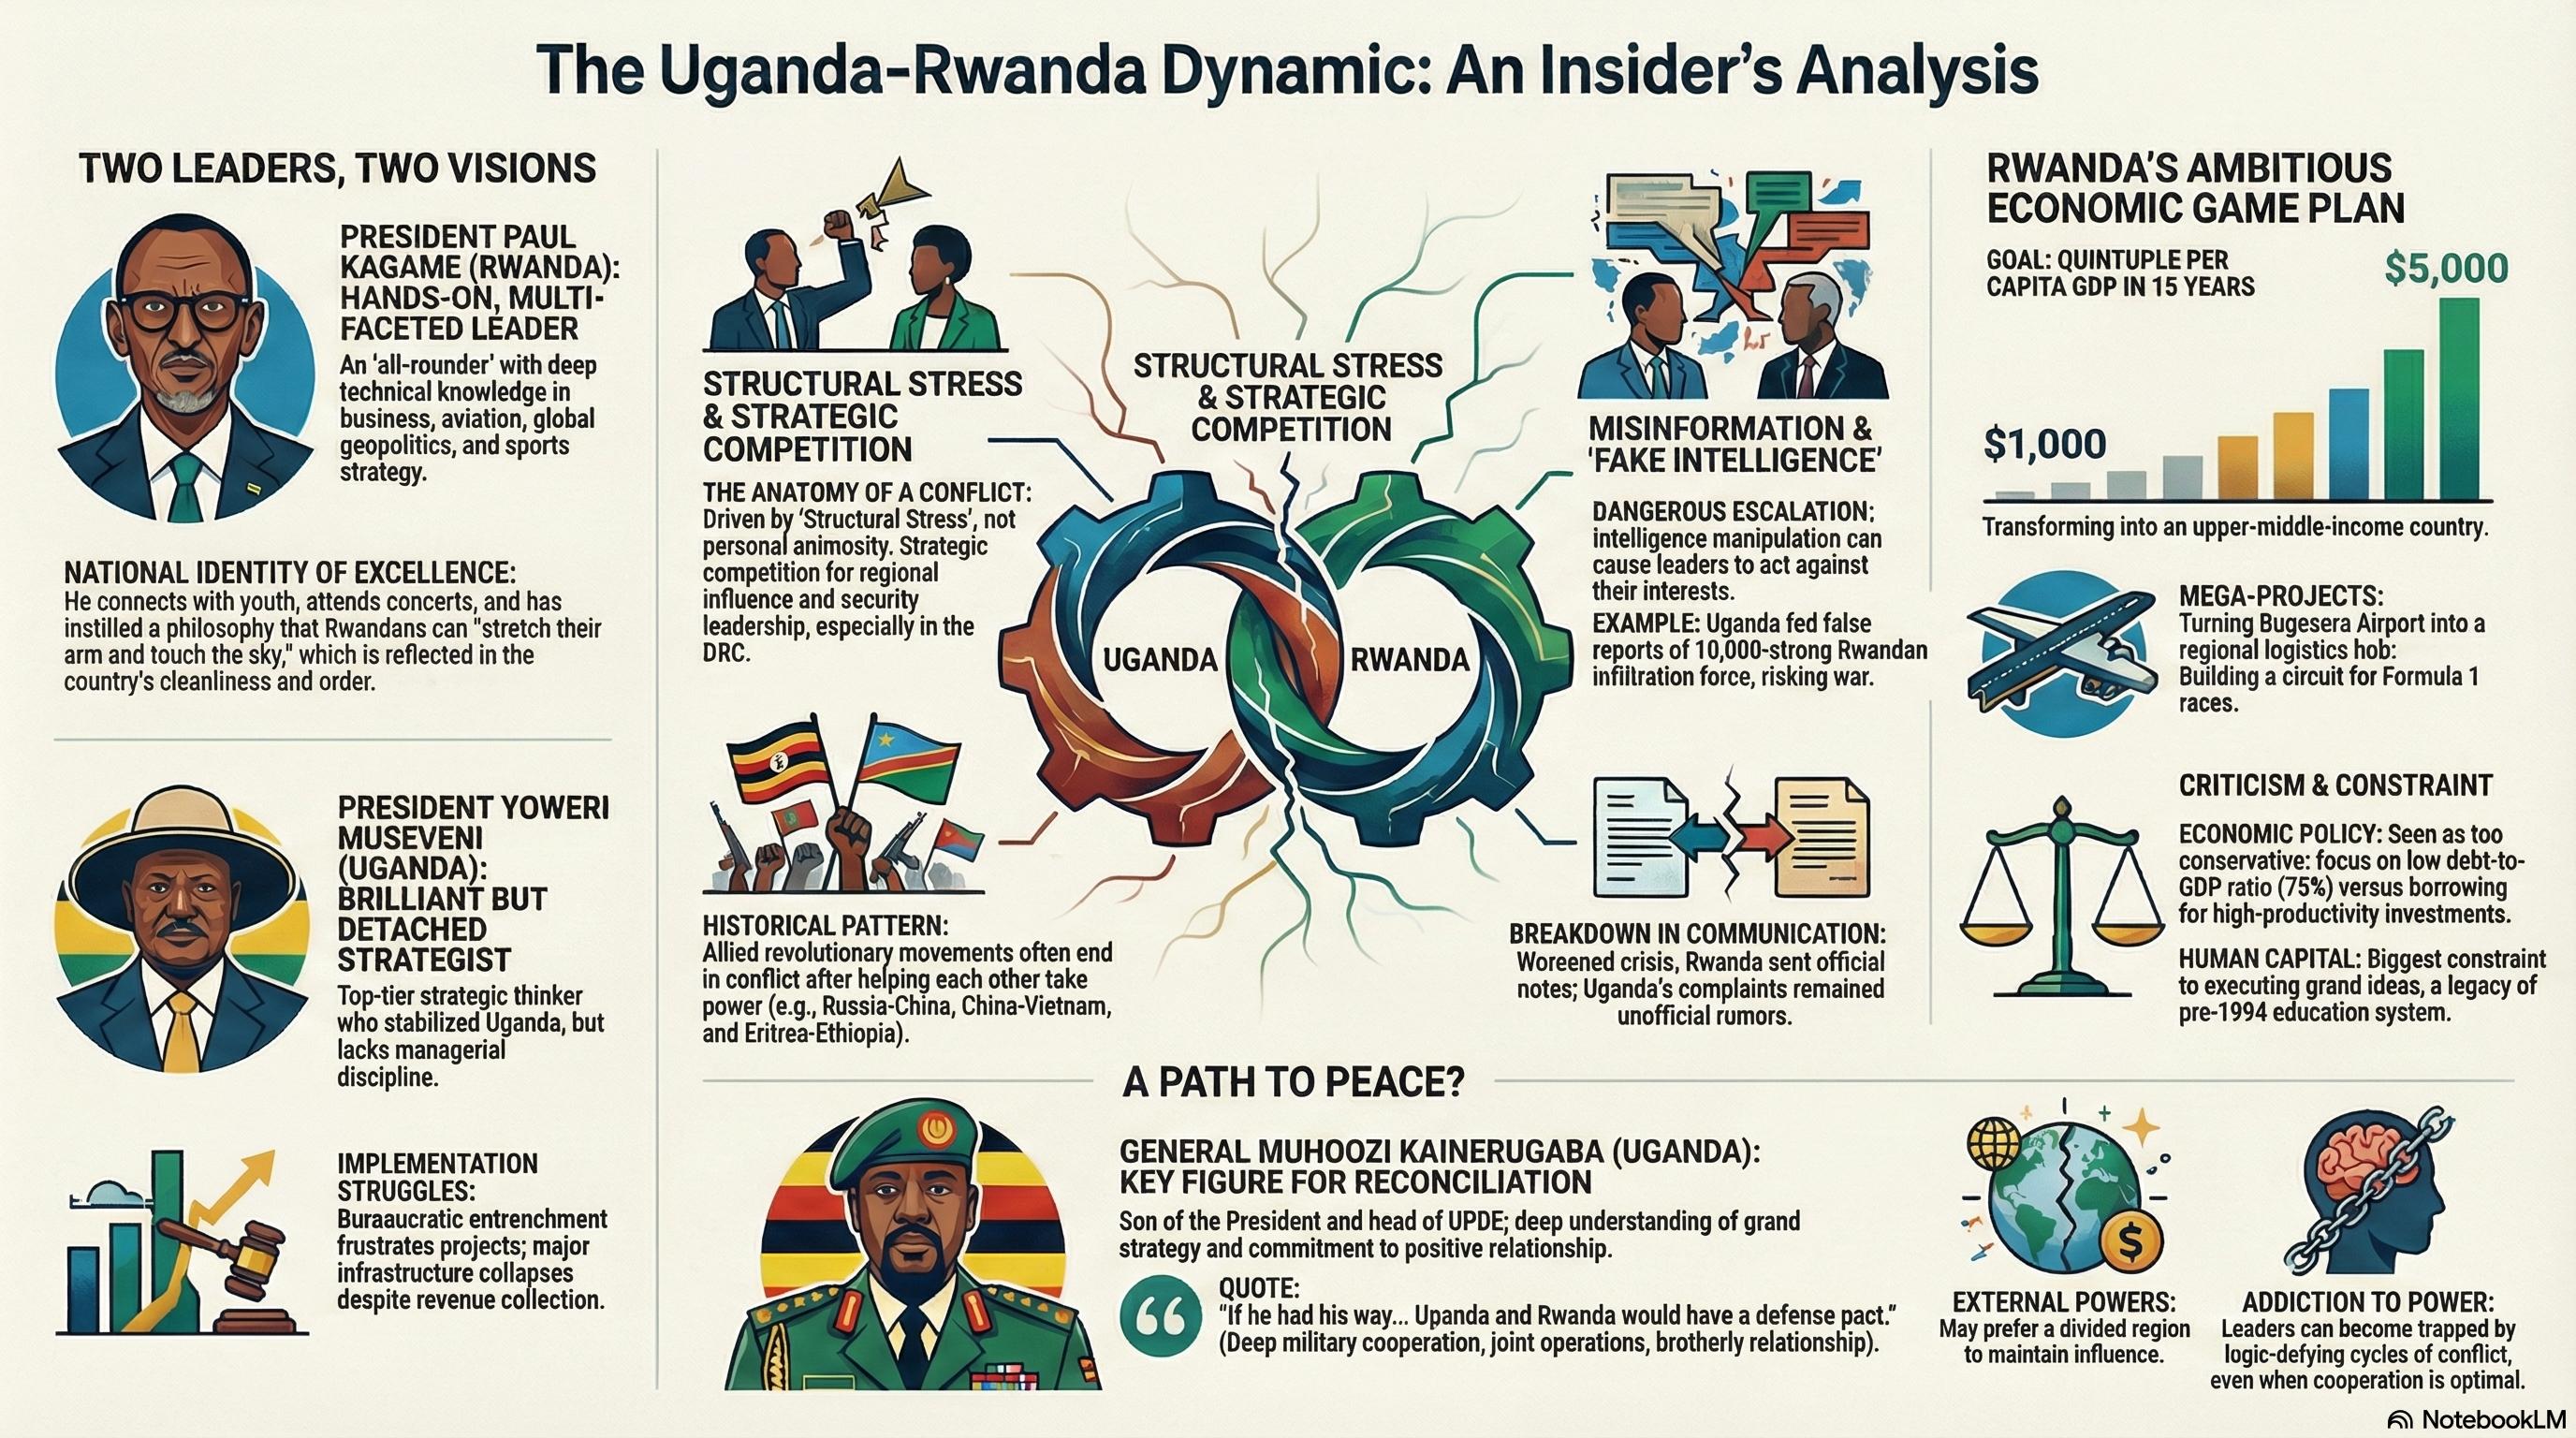
The detailed mode covered more ground - both leaders, economic vision, Muhoozi as potential peacemaker. But it dropped the personal relationship between Mwenda and Kagame, which is what makes his insights worth listening to in the first place.
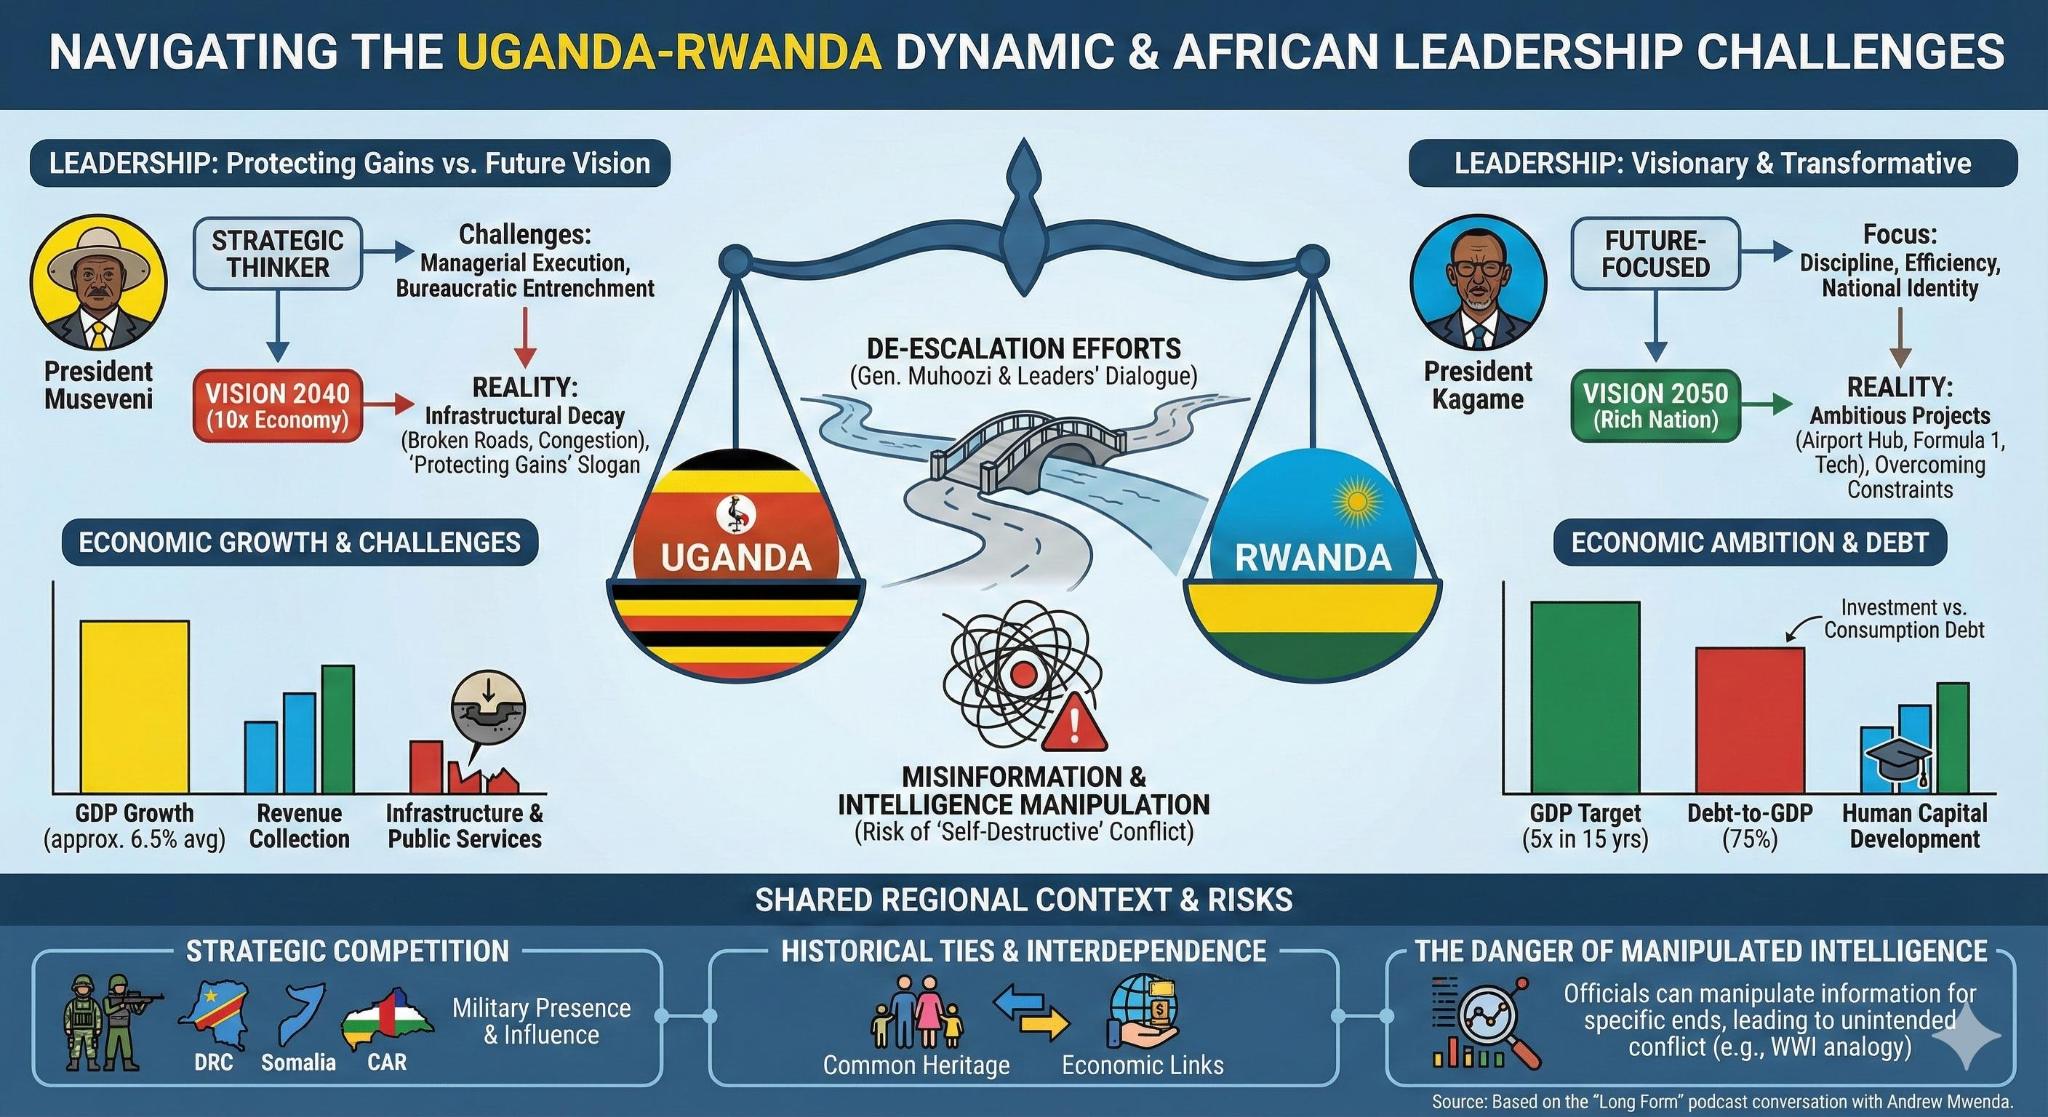
Gemini went analytical. Balance scales, statistics, “Uganda vs Rwanda” comparative framing. No quotes. No mention of Mwenda. It turned a conversation into a comparison chart.
Structured prompt results
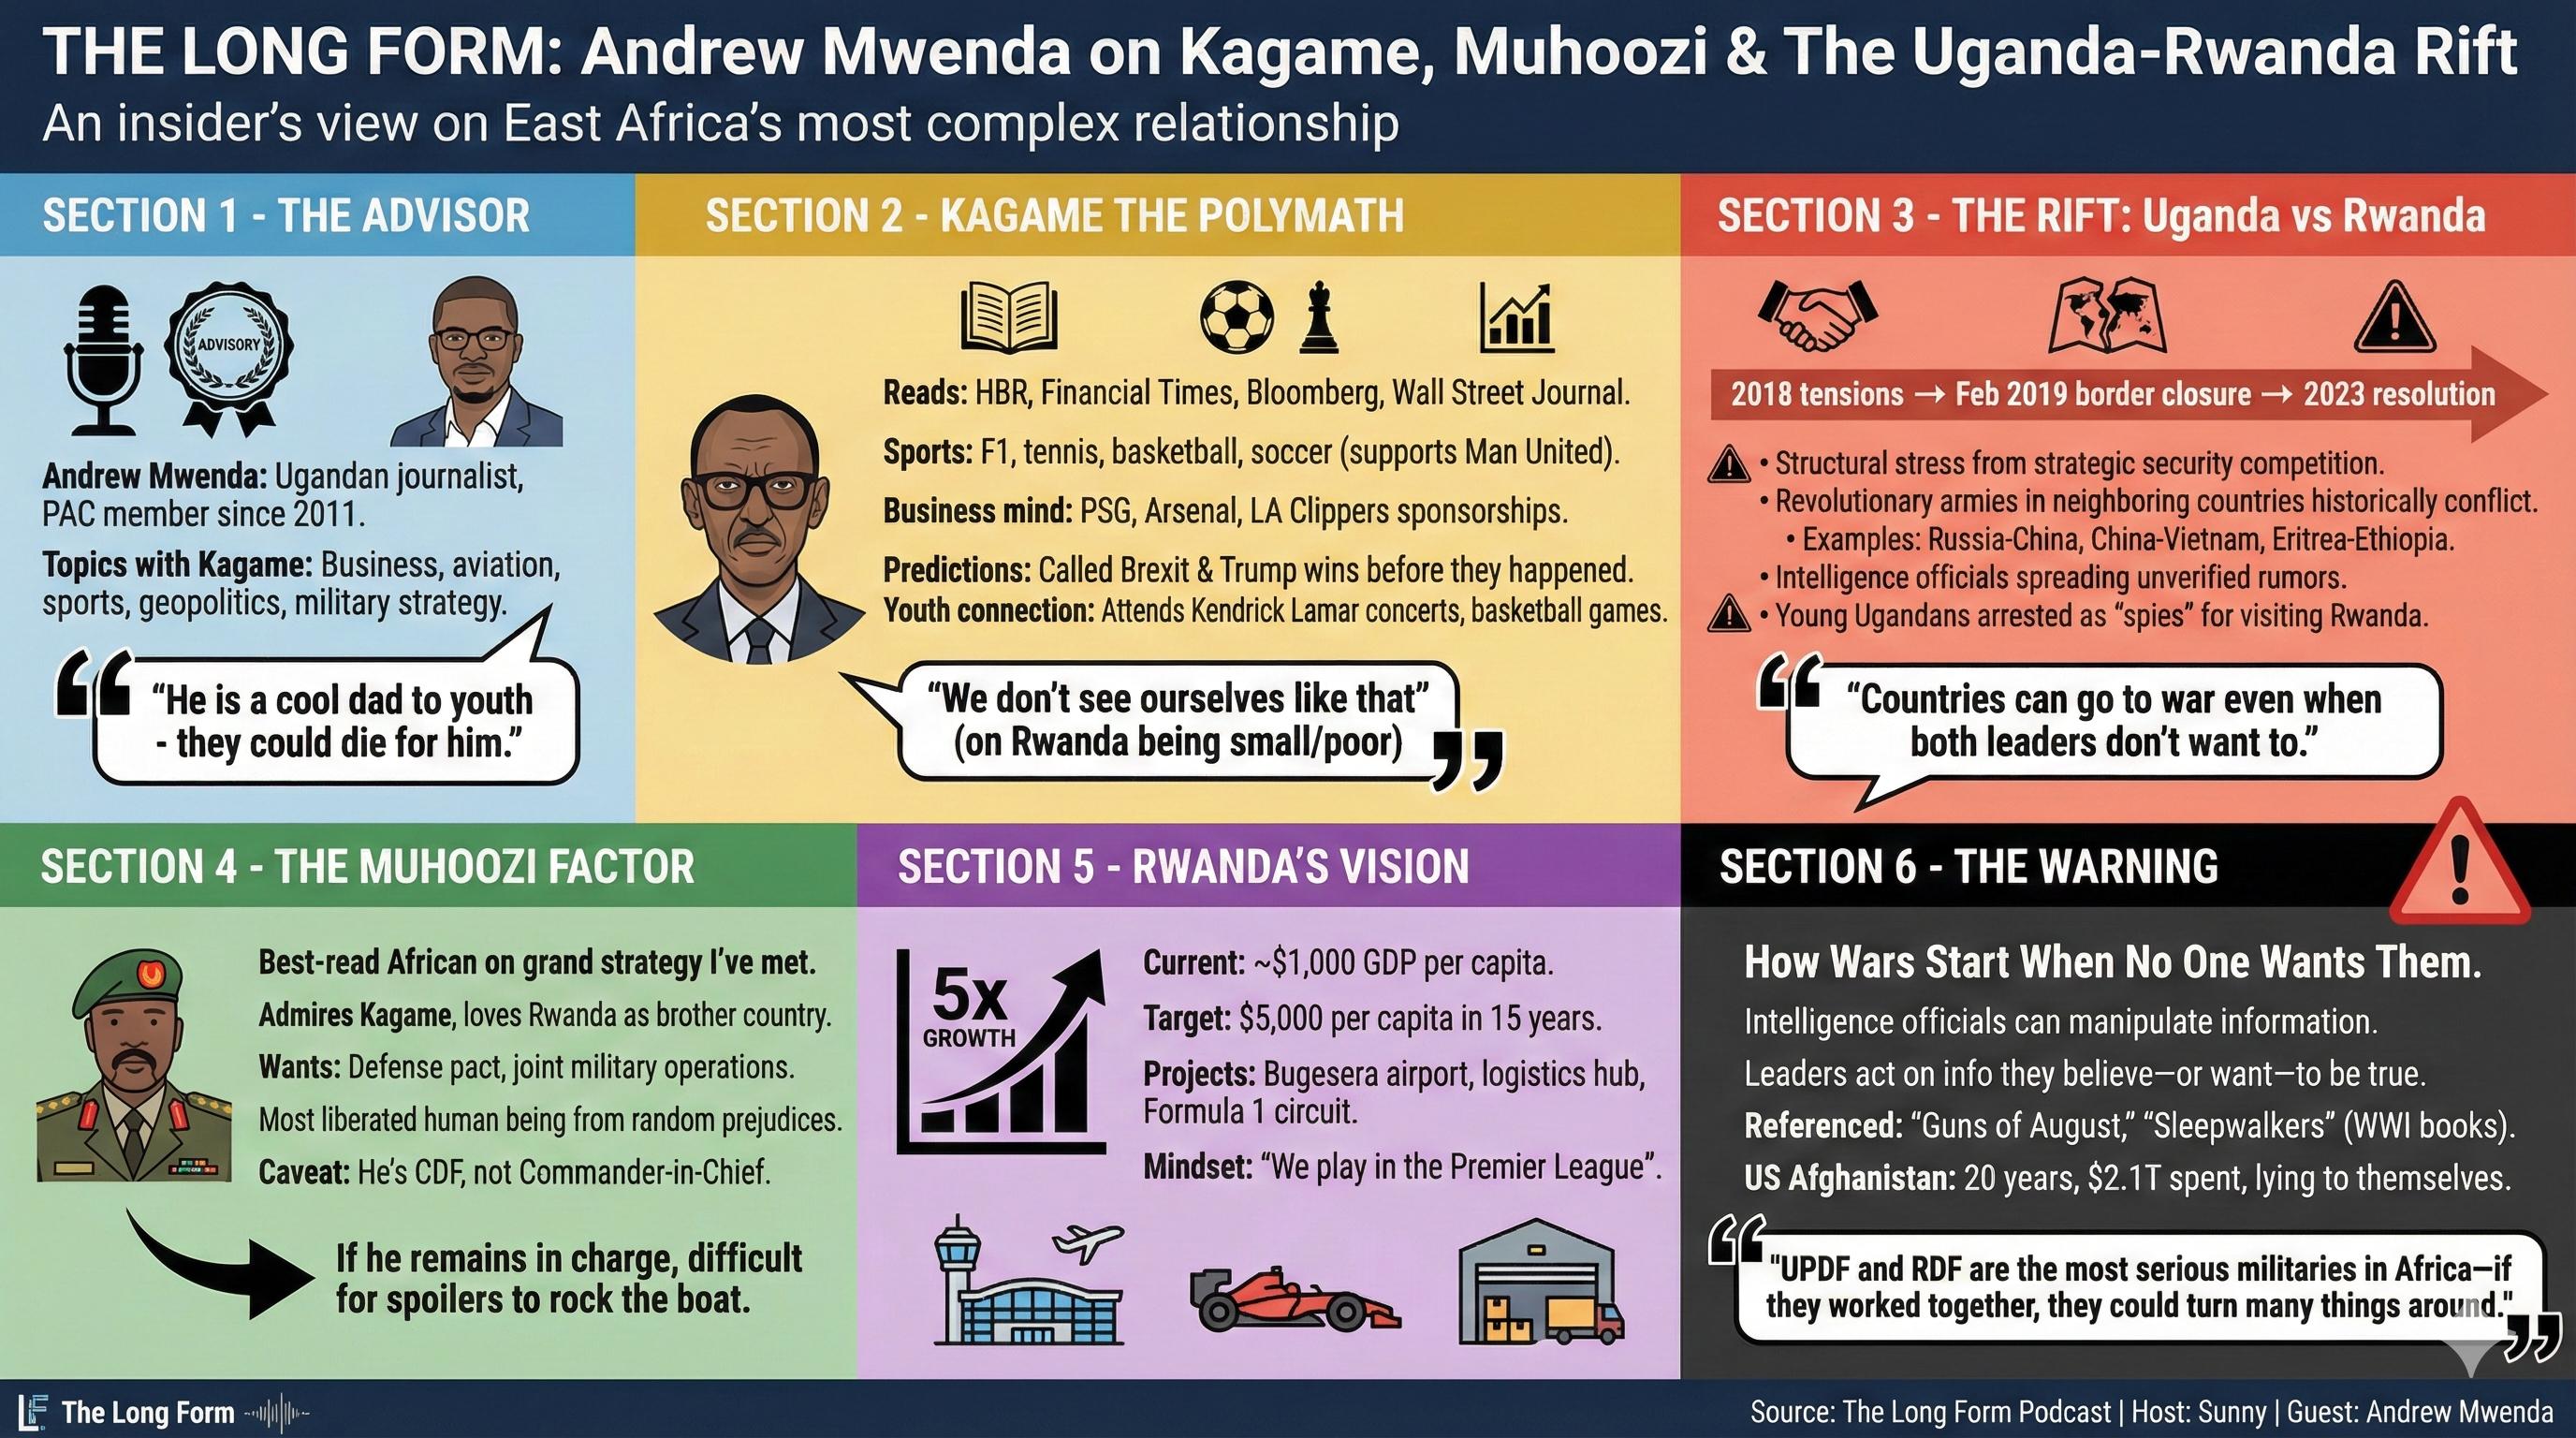
I had Claude listen to the podcast first and write a detailed prompt specifying sections, quotes, and themes:
Create a professional magazine-style infographic summarizing
a podcast interview between Sunny (The Long Form) and
Andrew Mwenda...
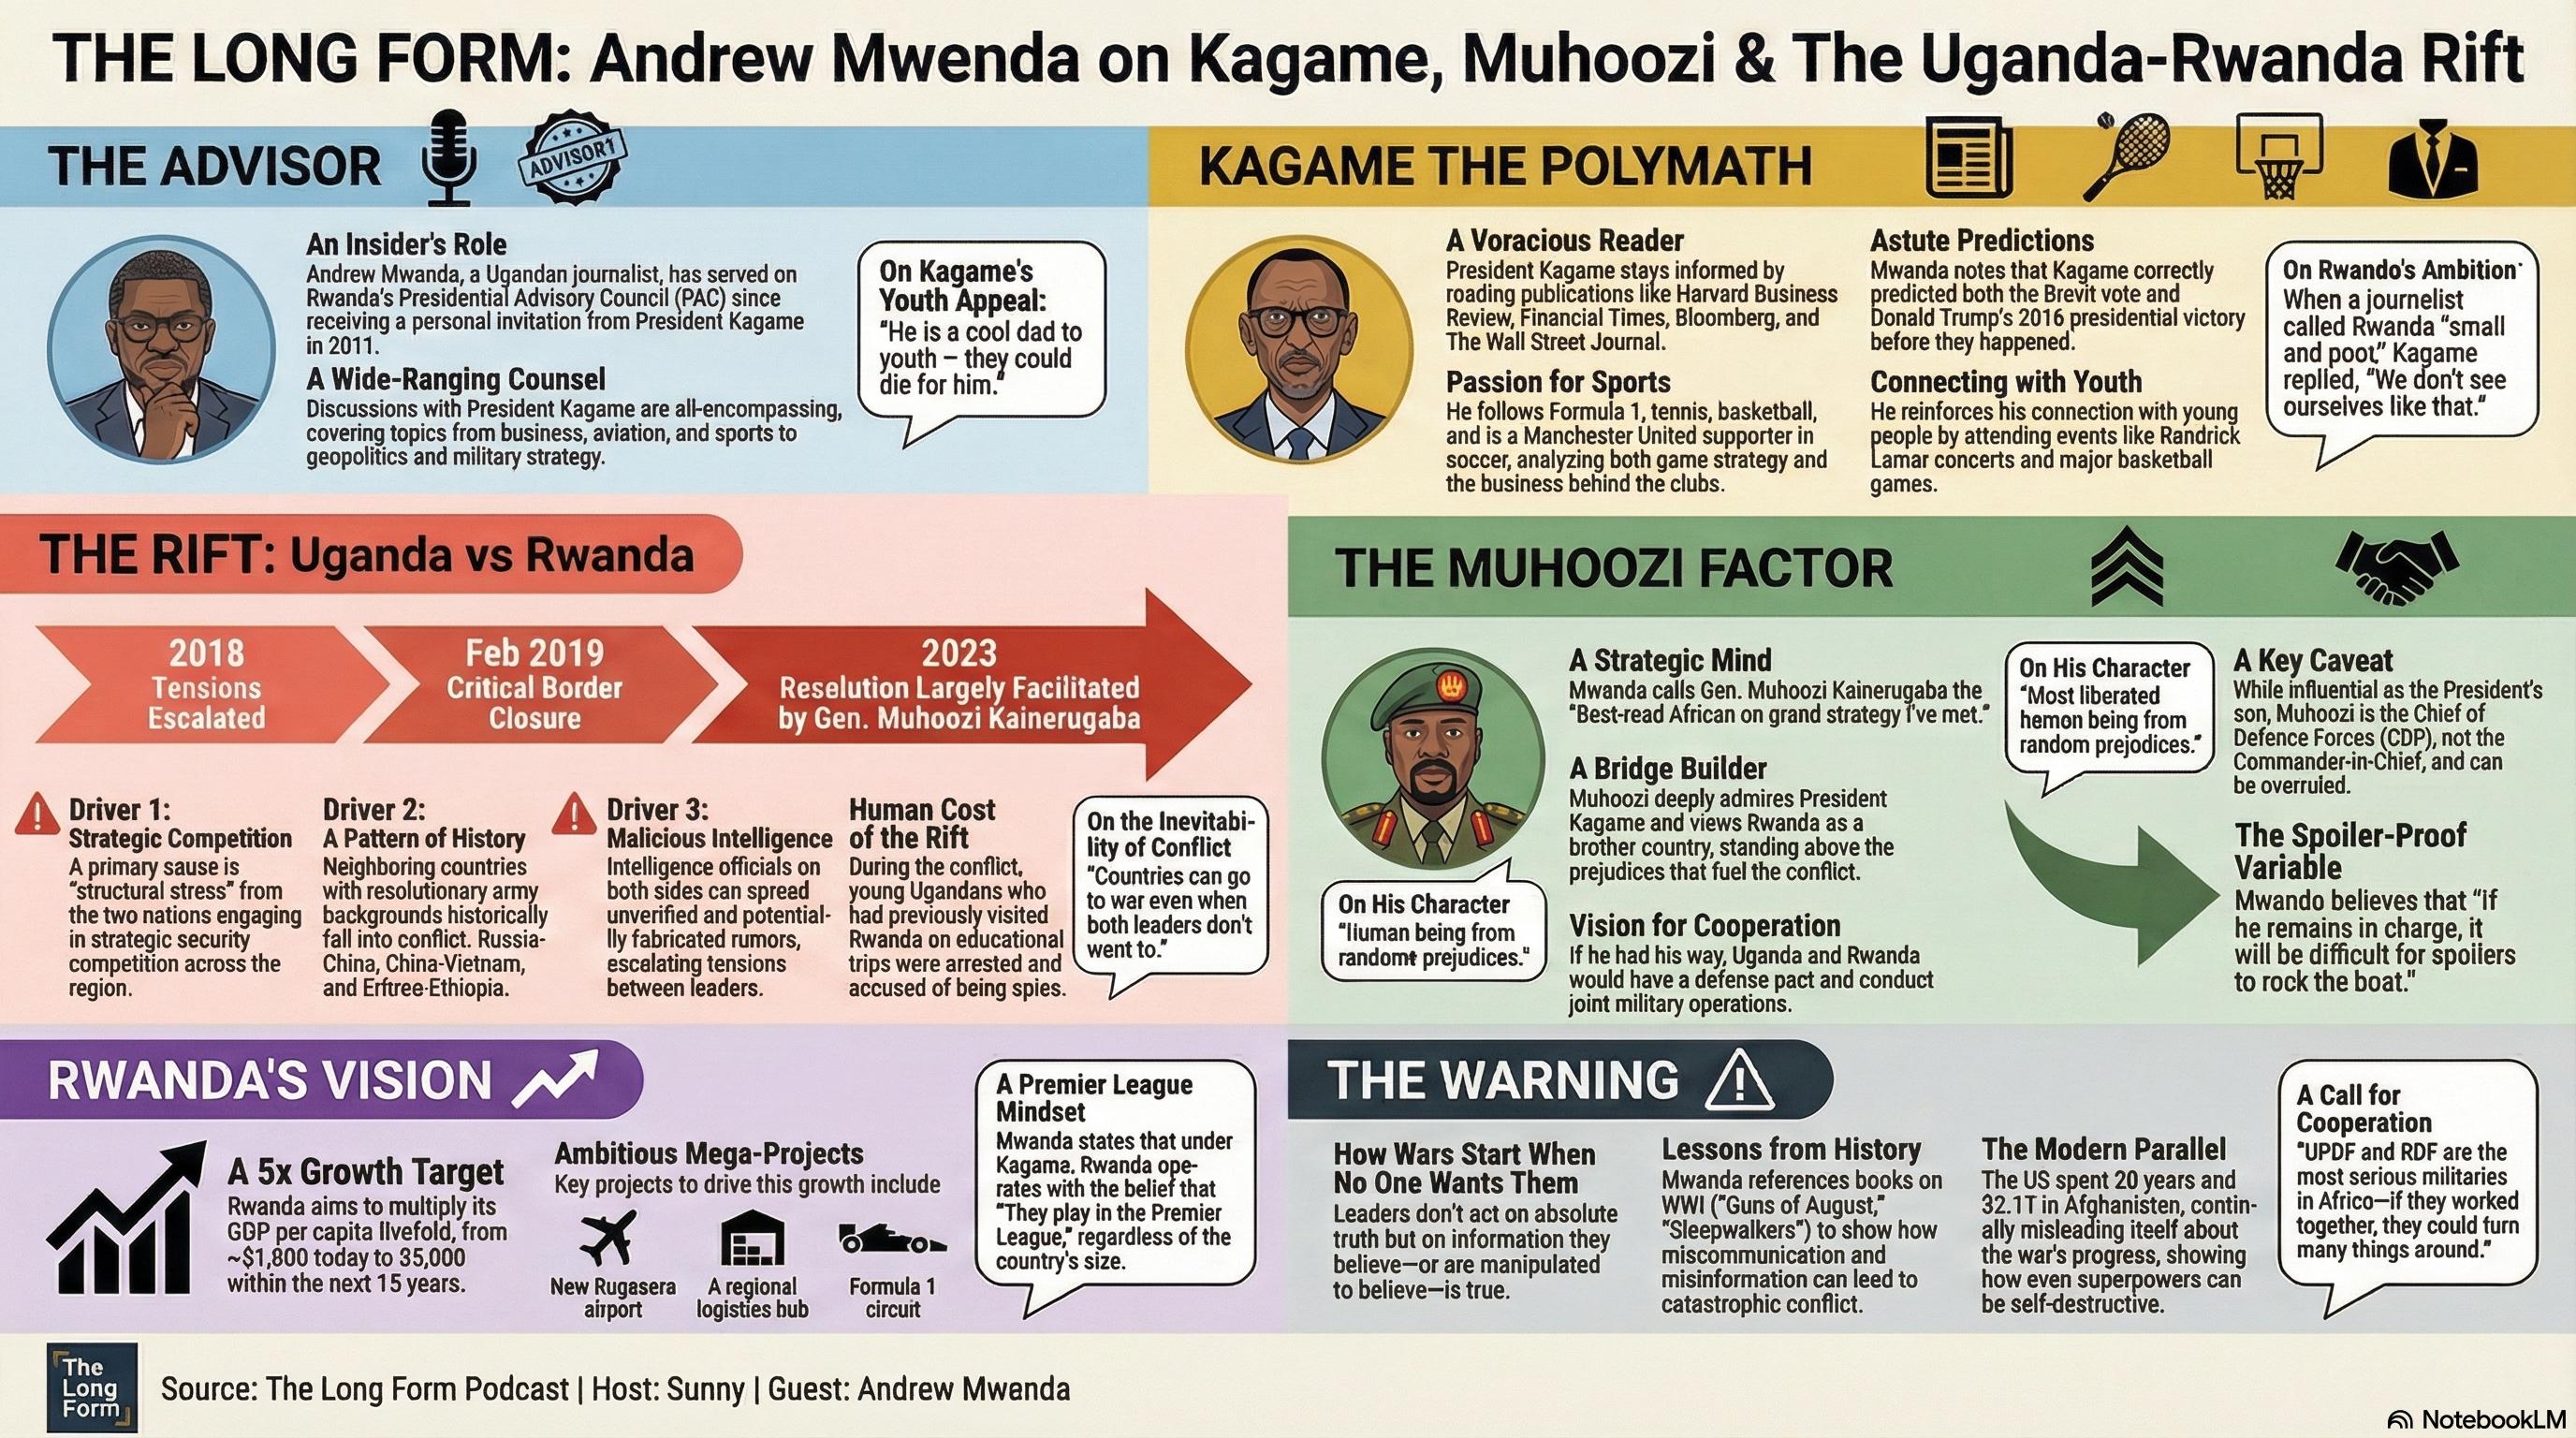
SECTION 1 - "THE ADVISOR" (Light purple block)
Andrew Mwenda: Ugandan journalist, PAC member since 2011
Topics with Kagame: Business, aviation, sports, geopolitics
Quote: "He is a cool dad to youth - they could die for him"
SECTION 2 - "KAGAME THE POLYMATH" (Gold block)
Reads: HBR, Financial Times, Bloomberg, Wall Street Journal
Sports: F1, tennis, basketball, soccer (supports Man United)
Predictions: Called Brexit & Trump wins before they happened
Quote: "We don't see ourselves like that" (on Rwanda being small)
[...6 sections total, each with specific quotes...]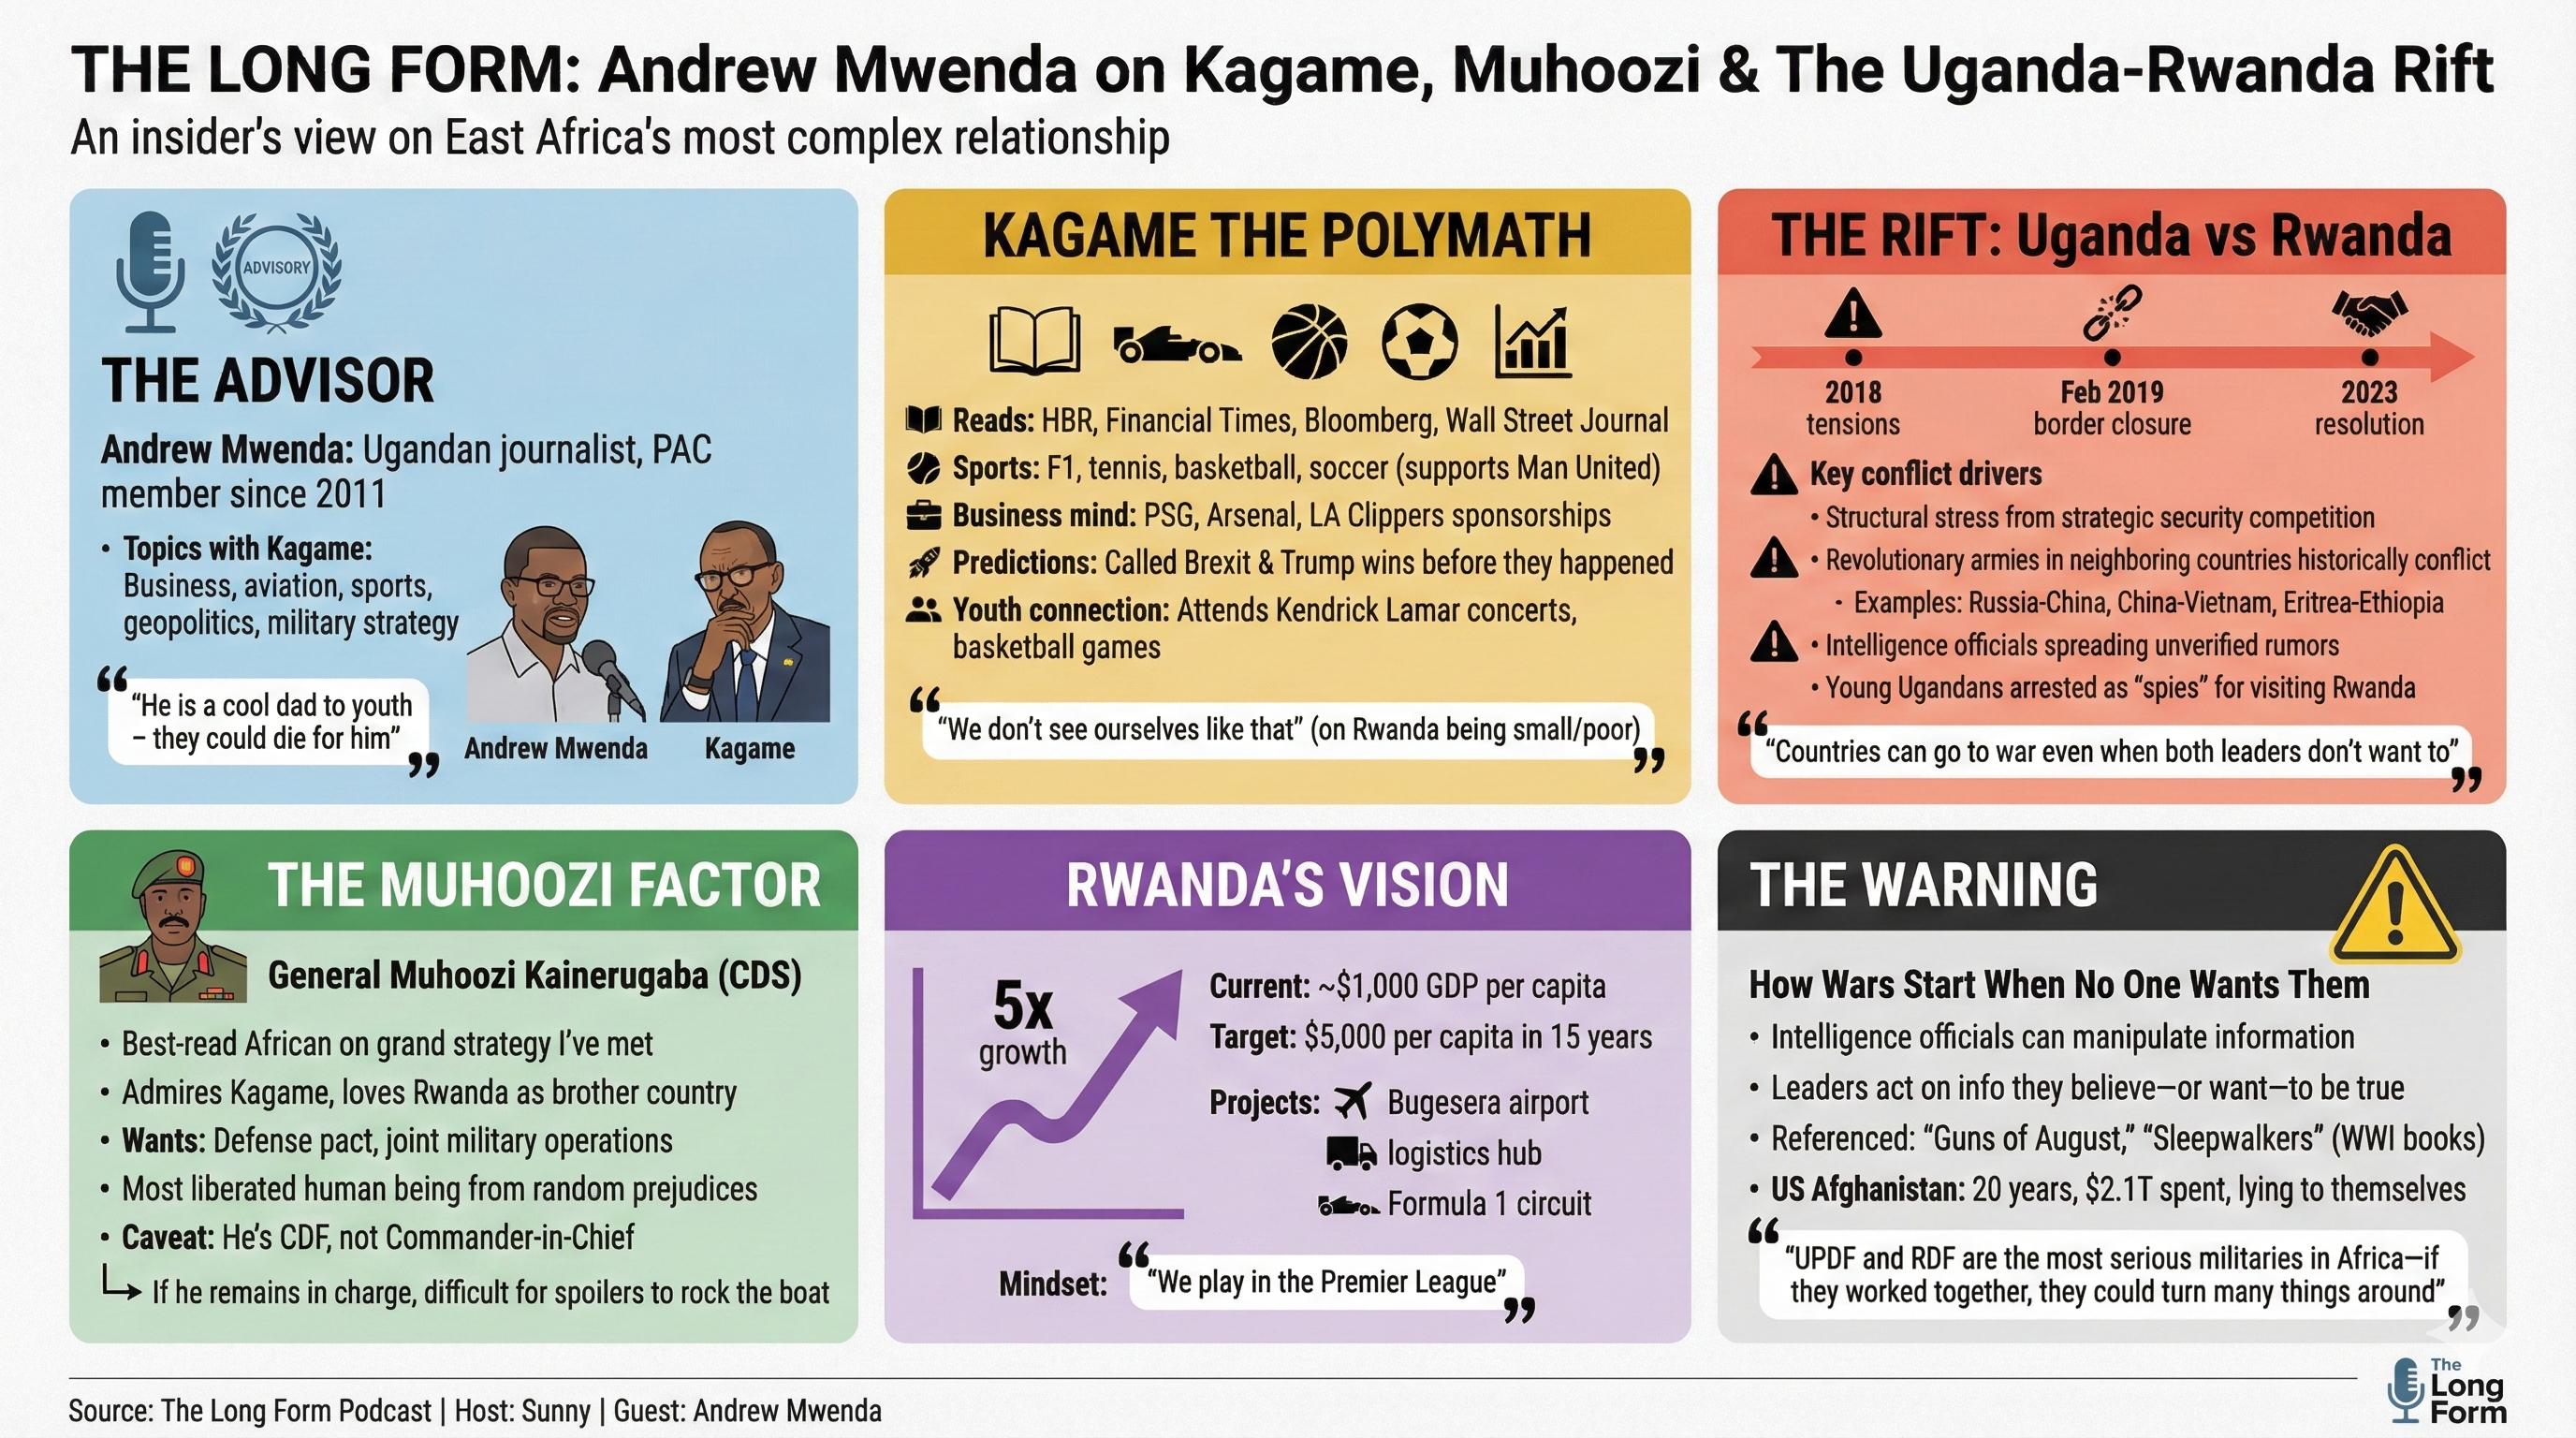
This one included every section and quote. Mwenda’s role was explained. Kagame’s polymath nature was captured. The warning about unintended war was there.
I generated it again to check consistency. Same coverage, slightly different visual treatment.
Results
| Approach | Coverage | Quotes | Human Element |
|---|---|---|---|
| NotebookLM General | 40% | 1 | None |
| NotebookLM Detailed | 75% | 2 | Some |
| Gemini Raw | 50% | 0 | None |
| Structured Prompt | 95% | 5-6 | Full |
The structured prompt approach covered significantly more of the source material.
I also tried having Gemini improve its own prompts
I asked Gemini to analyze its outputs and suggest better prompts. It generated three different visual styles:
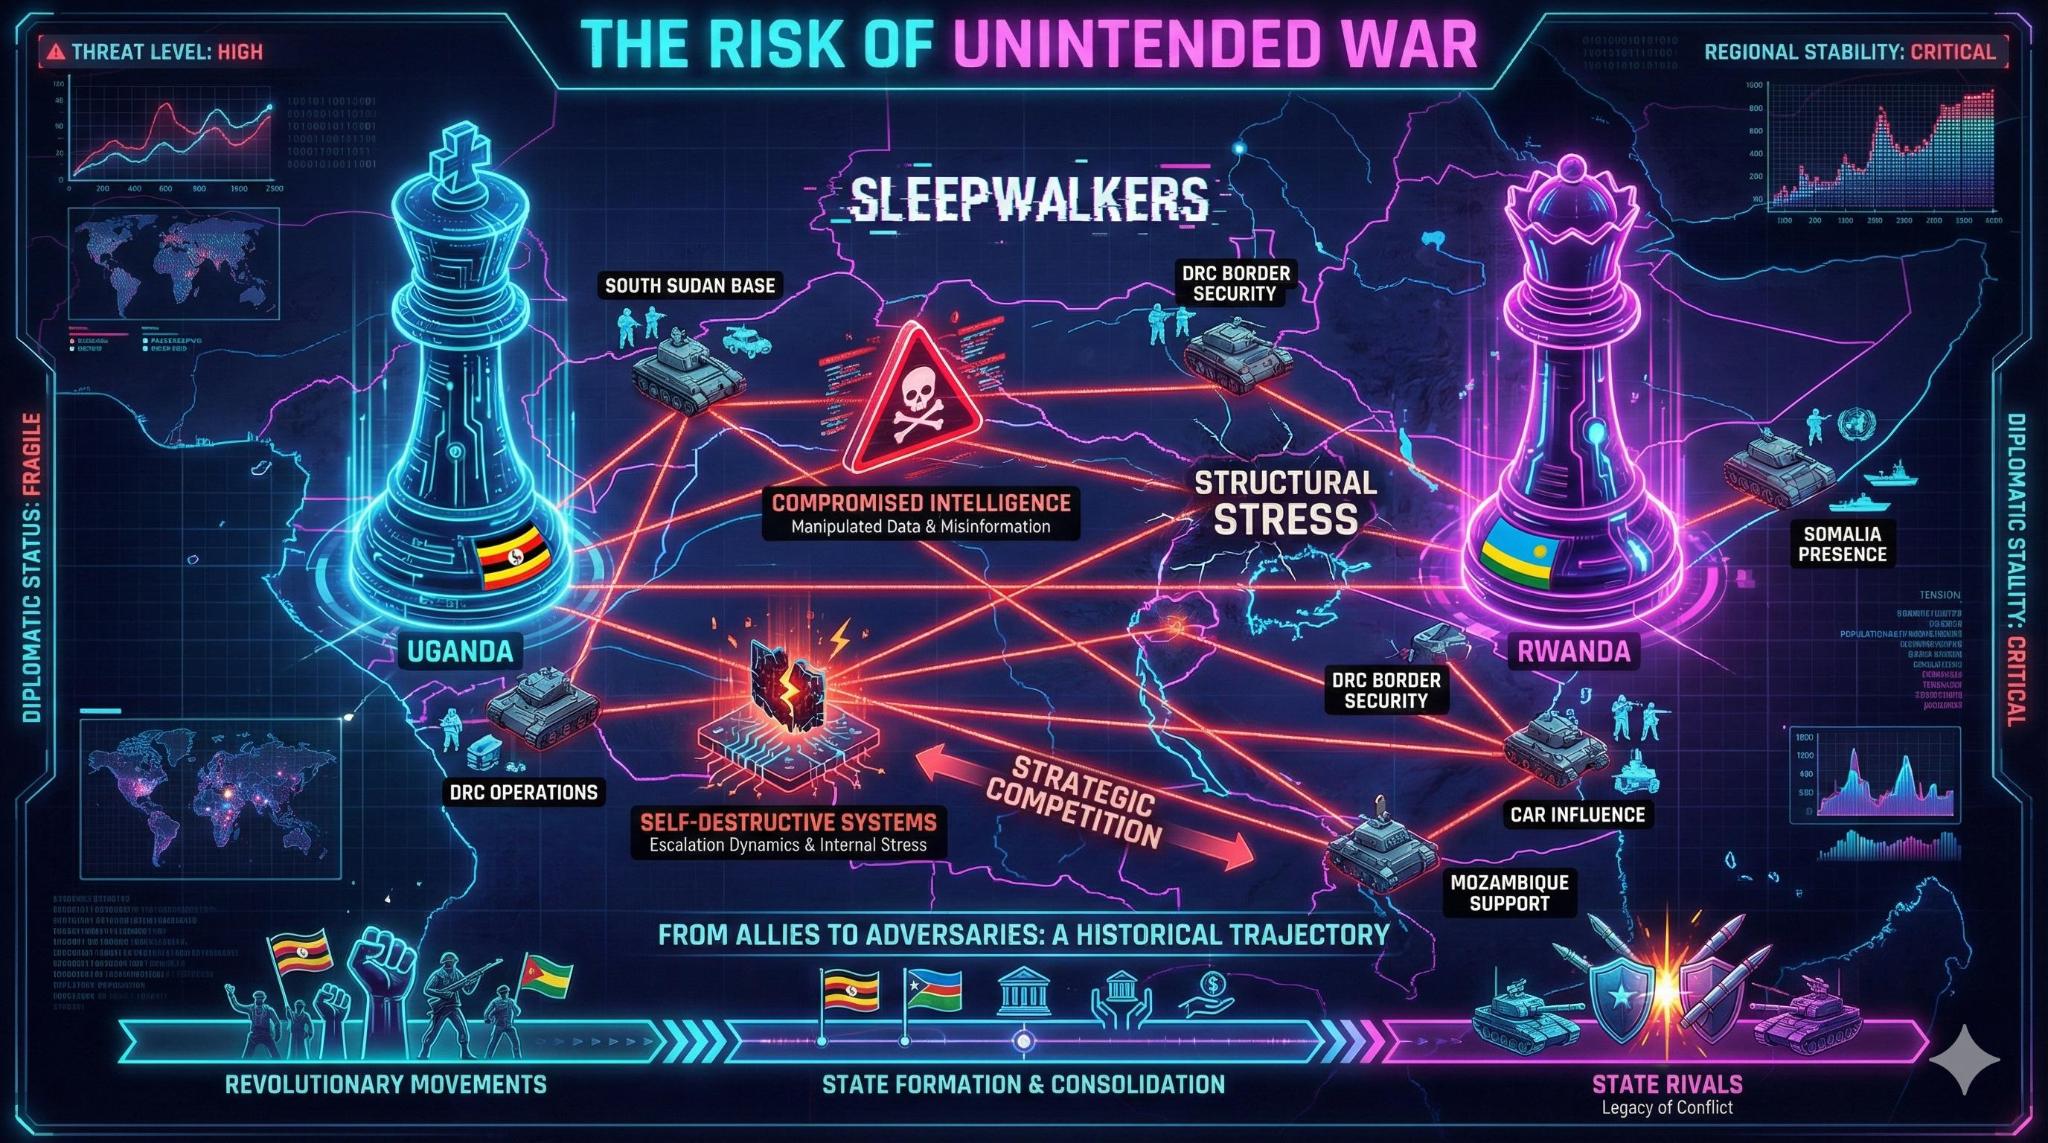
Dark mode with neon and military aesthetic.
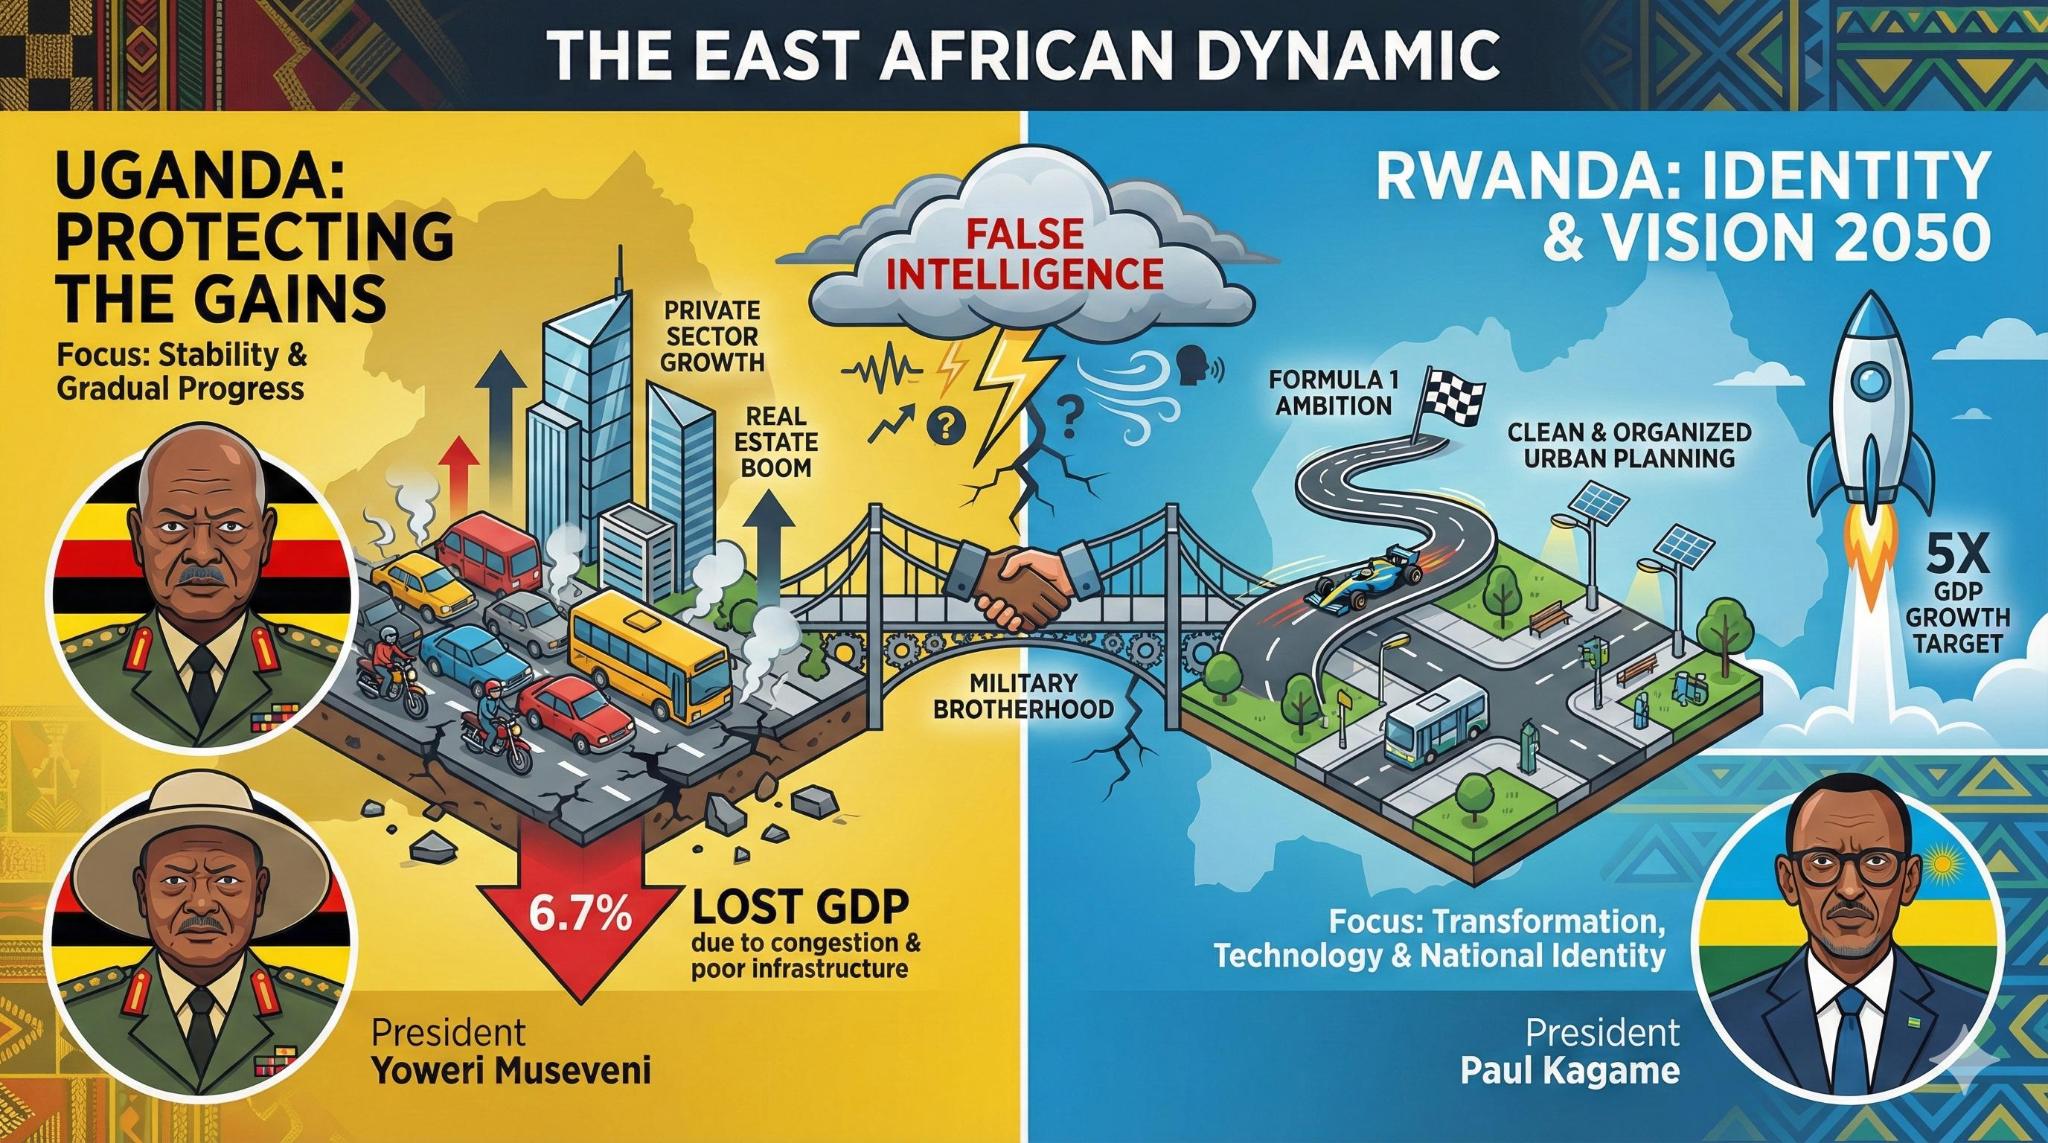
Uganda yellow versus Rwanda blue, split-screen rivalry framing.
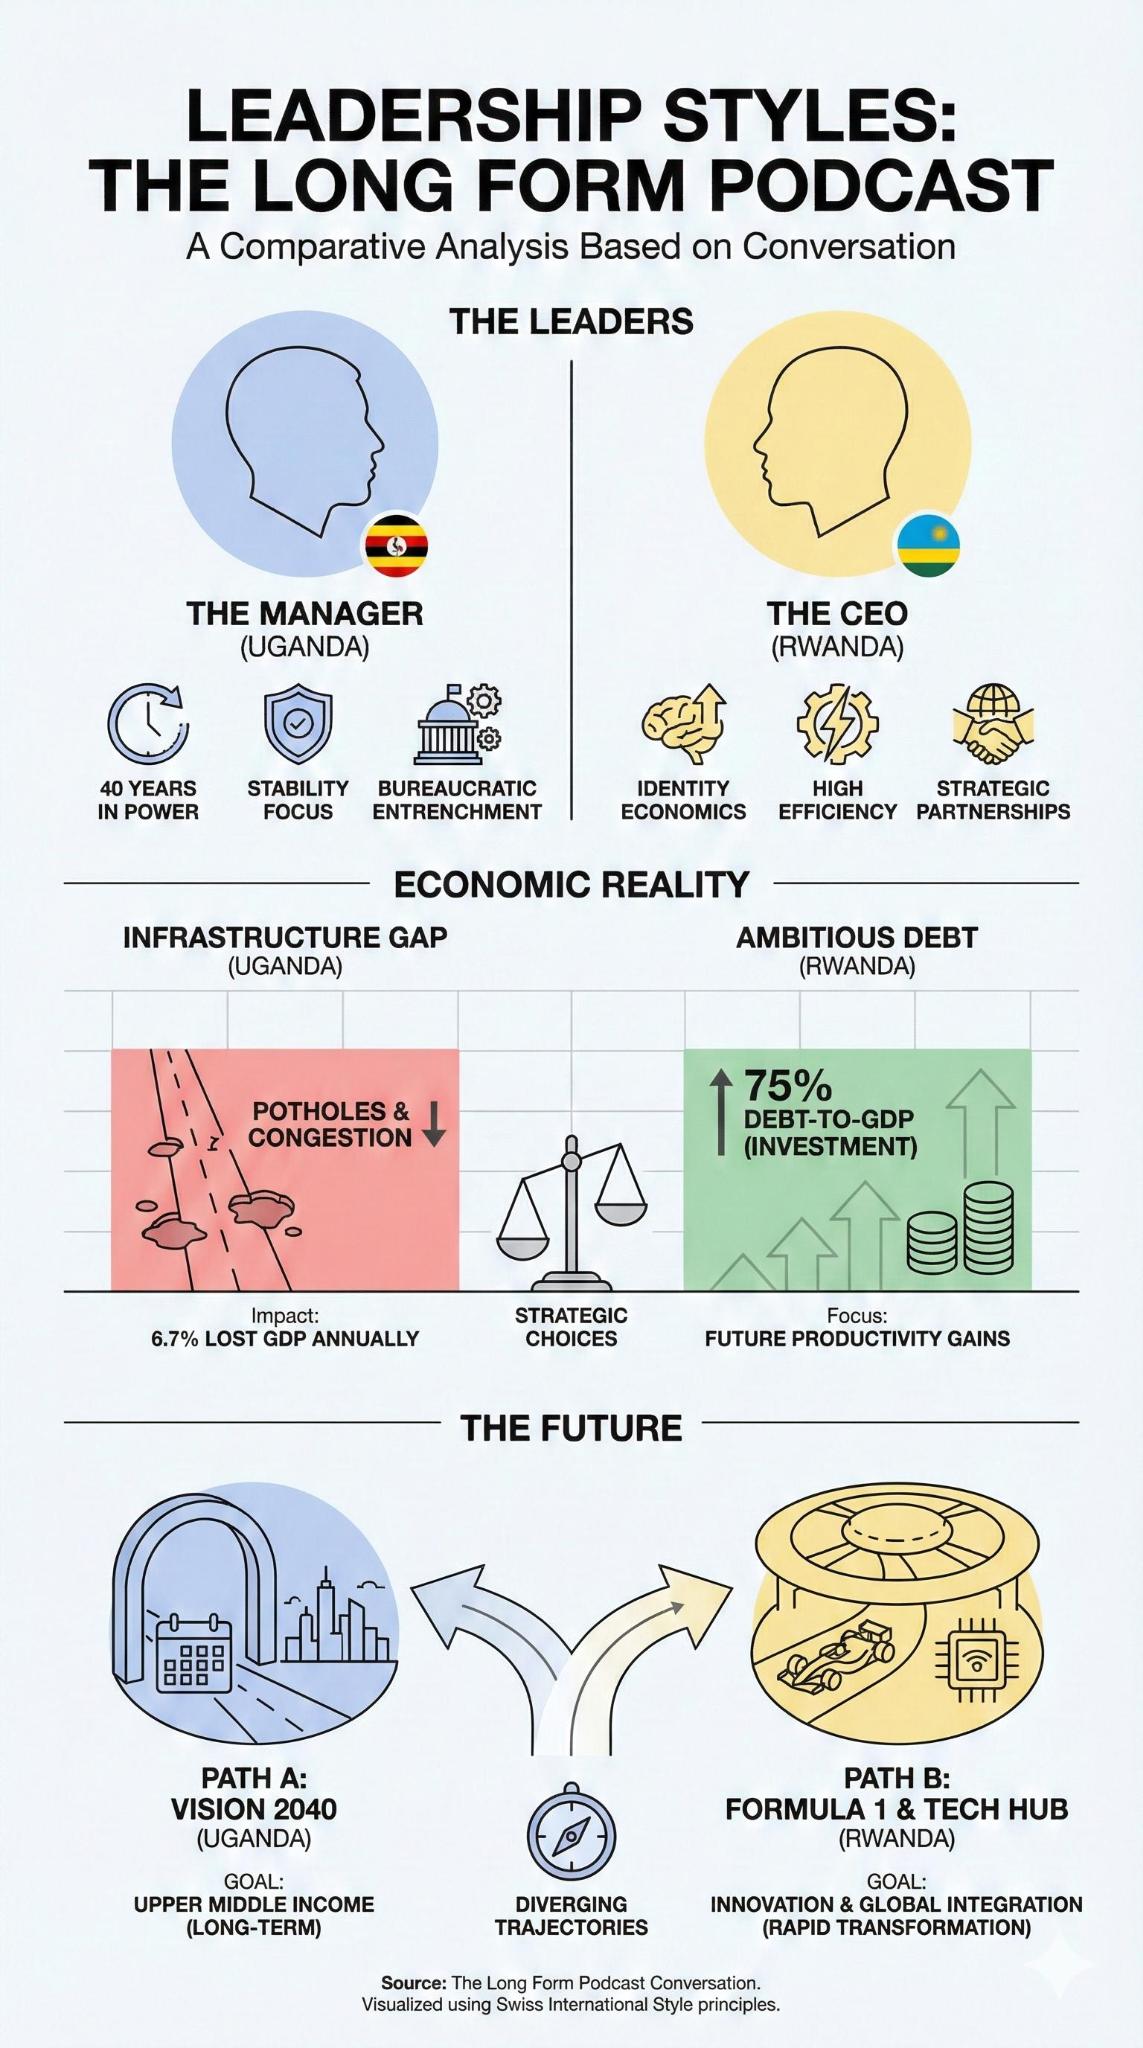
Clean Swiss minimalist style.
These all looked striking but had the same problem as before - they were missing the actual substance of the conversation. Better visual prompts didn’t fix the content problem.
Then I tried feeding Claude’s structured prompt to NotebookLM:
This produced the best result. Every section, every quote, proper source attribution. The structured prompt gave NotebookLM the content it needed, and NotebookLM rendered it well.
What I learned
If you skip the structuring step, the AI optimizes for visual clarity and makes its own editorial choices about what matters. Those choices tend to drop the human elements - relationships, specific quotes, personal context.
With structuring, you decide what quotes matter, what relationships to show, and what someone should take away from it.
The architecture that works:
YouTube URL
    ↓
Transcript extraction (free, easy)
    ↓
Content structuring (LLM identifies sections, quotes, themes)
    ↓
Detailed infographic prompt
    ↓
Image generation (Gemini 3 Pro Image)
    ↓
Visual infographic
Prompt template
If you want to try this:
Create a professional magazine-style infographic summarizing
[CONTENT TYPE] about [TOPIC].

TITLE: "[TITLE]"
SUBTITLE: "[SUBTITLE]"

LAYOUT: Landscape, [N] distinct sections with color-coded blocks

SECTION 1 - "[SECTION NAME]" ([COLOR] block)
[Content details, bullet points]
Quote: "[SPECIFIC QUOTE]"

SECTION 2 - "[SECTION NAME]" ([COLOR] block)
[Content details, bullet points]
Quote: "[SPECIFIC QUOTE]"

[Continue for all sections...]

VISUAL STYLE:
- Magazine-quality editorial layout
- Color-coded sections
- Speaker portraits/icons where relevant
- Icons for key concepts
- Direct quotes in speech bubbles
- Clear visual hierarchy
- Source attribution at bottom

OUTPUT: Landscape infographic, detailed but scannable
The work is identifying sections, selecting quotes, and deciding emphasis. That’s the part that can’t be skipped.
A tangent: 3D infographics
While working on this I started thinking about whether infographics need to be flat images. I played with Trellis V2, Microsoft’s image-to-3D model. It takes a flat image and turns it into a 3D object you can rotate.
Feeding it a full infographic produces a lumpy slab, but feeding it individual assets works. You could generate the chess piece, the storm cloud, the F1 car separately, convert each to 3D, and compose them in something like Spline.
The workflow would be:
2D AI (Midjourney/DALL-E)
    ↓
Generate individual assets (chess piece, storm cloud, F1 car)
    ↓
Image-to-3D (Trellis V2 / Rodin / Meshy)
    ↓
Actual 3D .glb files
    ↓
Spline (browser-based 3D tool that feels like Figma)
    ↓
Interactive 3D scene
Instead of a flat image, you’d have a scene you could navigate. Hover over the storm cloud to see the quote about sleepwalking into war. Click the F1 car to see Kagame’s Vision 2050 data.
Tools worth looking at:
- Spline - Browser-based 3D, similar to Figma
- Rodin/Meshy - Upload a 2D image, get a 3D model back
- BlenderKit - Asset library inside Blender
I haven’t built this yet, but it’s an interesting direction.
December 2025. Test content: The Long Form podcast, Andrew Mwenda interview.